

TIMS Service Indicators - A New Look
by: Jody Pressley, TIMS Project Leader, UNC-Charlotte
It has been a busy start for the school year as students go back to school and bus drivers learned their new routes, and in many LEAs, implemented the new student crossing procedures at bus stops.
School buses constitute the state’s largest public transit system. An estimated 13,400 buses will carry some 800,000 NC students to school and back during the 2015-16 academic year, traveling just over 180 million miles.
The Transportation Information Management System (TIMS) is a computer-assisted school bus routing system used by Local Education Agencies (LEAs) in North Carolina to plan efficient transportation of students to and from school. For many years, school bus personnel have submitted TIMS data to track school bus service across the state. This year, we want to introduce you to something new to help you visualize how the TIMS Service Indicators are used to compile numbers about school bus service across the state. How long is the average bus ride in each school district? How long are the longest rides? How far do students have to travel to the bus stop? Using the information your school district submits as TDTIMS data has all of this in the booklet published each year that outlines all of this data. The printed TIMS Service Indicators may be seen here.
Data visualization is described as an effort to help people understand the significance of data by placing it in a visual context. Patterns, trends and correlations that may go unnoticed in a report can be exposed and recognized easier using data visualization software. This year, UNC-Charlotte Urban Institute researchers compiled maps, working with TIMS project leaders to help visualize the TDTIMS data, in particular three areas.
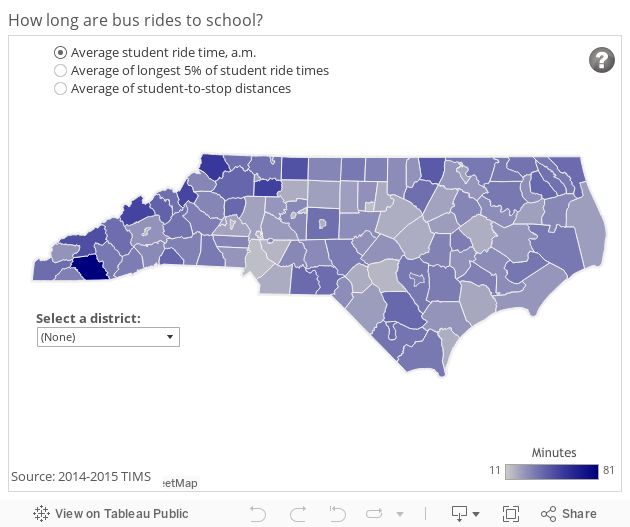
As you can see from the maps below, TIMS data show the average ride time per NC student was 23 minutes and the average distance to school was 4.37 miles, with 55 percent of the total public school population riding buses. The earliest average bus stop time was 5:46 am; for a 7:30 am bell time. Across the state, 13,365 buses ran for 180 days, traveling 179,971.379 miles.
The average morning bus rides range from 11 minutes in Roanoke Rapids City Schools in northeast North Carolina to 81 minutes in Macon County, in the state’s far western mountains. Among the longest bus rides statewide (the average of the longest 5 percent of rides in each county), the longest is 200 minutes, again in Macon County. That unusually long average ride resulted from one student from a remote part of the county choosing to attend an early college program in Franklin, a trip requiring several shuttle rides. In a county of just 34,000 people, one lengthy ride can skew the average.
The shortest of those lengthy rides – 31 minutes, was in Roanoke Rapids City Schools. Students in Gates County, in the northeast corner of the state, average only 66 feet from where they live to the school bus stop, while those in the rural Clay County average 1,090 feet, about a quarter mile.
Comparing school bus rides in North Carolina
Click on radio buttons to show various school bus statistics. To see information for each school district, mouse over the map, or choose a district from the drop-down menu. Coming soon we will introduce you to even more data that will allow you to use drop-down boxes to pick and choose districts you would like to compare the different TIMS service indicators.